![]()
Gold Stocks’ Winter Rally 7
Adam Hamilton October 28, 2022 3023 Words
The gold miners’ stocks have been battered over this past half-year, bludgeoned relentlessly lower with gold. Heavy gold-futures selling fueled by the US dollar shooting parabolic in a mania has slammed the yellow metal. Gold’s normal seasonal trends have been overpowered by speculators’ leveraged gold-futures dumping. But with their selling capital firepower exhausted, gold’s usual winter rally should roar back.
Seasonality is the tendency for prices to exhibit recurring patterns at certain times during the calendar year. While seasonality doesn’t drive price action, it quantifies annually-repeating behaviors driven by sentiment, technicals, and fundamentals. We humans are creatures of habit and herd, which naturally colors our trading decisions. The calendar year’s passage affects the timing and intensity of buying and selling.
Gold stocks display strong seasonality because their price action amplifies that of their dominant primary driver, gold. Gold’s seasonality generally isn’t driven by supply fluctuations like grown commodities see, as its mined supply remains relatively steady year-round. Instead gold’s major seasonality is demand-driven, with global investment demand varying considerably depending on the time in the calendar year.
This gold seasonality is fueled by well-known income-cycle and cultural drivers of outsized gold demand from around the world. And the biggest seasonal surge of all is just getting underway heading into winter. As the Indian-wedding-season gold-jewelry buying that normally drives this metal’s big autumn rally winds down, the Western holiday season ramps up. The holiday spirit puts everyone in the mood to spend money.
Men splurge on vast amounts of gold jewelry for Christmas gifts for their wives, girlfriends, daughters, and mothers. The holidays are also a major engagement season, with Christmas Eve and New Year’s Eve being two of the biggest proposal nights of the year. Between a third to half of the entire annual sales of jewelry retailers come in November and December! And jewelry historically dominates overall gold demand.
The World Gold Council closely tracks global gold supply and demand, publishing the latest data each quarter. During the last five calendar years, jewelry demand averaged 49.1% of overall total world gold demand. That is much larger than investment demand, which averaged 31.9% during that same 2017-to-2021 span. Year to date in 2022 as of the end of Q2, jewelry demand is tracking at a similar 45.7% of total.
The usual frenzied Western jewelry buying heading into Christmas shifts to pure investment demand after year-end. That’s when Western investors figure out how much surplus income they earned during the prior year after bonuses and taxes. Some of this is plowed into gold in January, driving it higher. Finally the big gold winter rally climaxes in late February on major Chinese New Year gold buying flaring up in Asia.
So during its bull-market years, gold has always tended to enjoy powerful winter rallies driven by these sequential episodes of outsized demand. Naturally the gold stocks follow gold higher, amplifying its gains due to their great profits leverage to the gold price. Today gold stocks are now once again heading into gold’s strongest seasonal rally of the year, driven by this annually-recurring robust winter gold demand.
Since it is gold’s own demand-driven seasonality that fuels gold stocks’ seasonality, that’s logically the best place to start to understand what normally happens in coming months. This latest gold-winter-rally analysis is complicated by recent technical events. Between early March’s anomalous geopolitical-spike high on Russia invading Ukraine to late September, heavy gold-futures selling pummeled gold 20.9% lower.
So the yellow metal was just slammed into bear-market territory, technically making 2022 a bear year! Gold’s price action in bull years and bear years is quite different, and it’s bull-market seasonality we’re interested in. That certainly calls into question whether this old research thread is applicable this winter. But because of what drove gold’s recent 20%+ plunge, odds are it is an oversized correction in a secular bull.
Gold’s geopolitical spike to $2,051 lasted a single trading day, leaving gold unsustainably overbought as I warned at the time. Without that short-lived peak, gold’s total selloff over the next 6.6 months would have been 18.8%. That’s a large major correction, but not a new bear. And the dominant driver of the recent big selling was speculators’ heavy-to-extreme gold-futures dumping, which is anomalous and self-limiting.
These hyper-leveraged traders’ capital firepower available for selling is very finite. And that sure looks exhausted based on historical precedent. They’ve liquidated about as many long contracts as they are likely able to, recently crushing total spec longs to a deep 3.4-year low! And they’ve pretty much hit their probable limit on short selling too, with total spec shorts soaring to a stunning 3.8-year high in late September!
Such spec-gold-futures bearish-positioning extremes never last long, soon giving way to massive mean-reversion buying that catapults gold sharply higher. After the last similar episode in May 2019, gold rocketed up 21.5% in just 3.3 months! This inevitable coming big gold-futures buying will be accelerated by the wildly-overcrowded long-US-dollar trade rolling over. So gold’s recent lows aren’t likely to last very long.
Technically gold’s next bull-market upleg could already be underway, and will likely be confirmed during this year’s winter-rally span. Specs’ mandatory gold-futures short-covering buying quickly pushes gold high enough to attract back other long-side speculators. Their larger buying soon drives enough upside momentum to entice investors to chase gold with their vastly bigger pools of capital, supercharging its gains.
So with gold barely in bear territory measured from an artificial high, and the recent selloff mostly fueled by heavy-to-extreme gold-futures selling that has to soon reverse, we ought to give gold the benefit of the doubt seasonally. 2022 might yet end up being a gold-bull year, and it certainly isn’t a normal gold-bear one! The gold-bull years for seasonal analysis in modern history ran from 2001 to 2012 and 2016 to 2021.
Gold’s earlier mighty bull market ran from April 2001 to August 2011, where it soared 638.2% higher! And while gold consolidated high in 2012, that was technically a bull year too since gold only slid 18.8% at worst from its bull-market peak. Gold didn’t enter formal bear-market territory until April 2013, thanks to the crazy stock-market levitation driven by extreme distortions from the Fed’s QE3 bond monetizations.
That bear ultimately mauled gold to a 6.1-year secular low in mid-December 2015, which birthed another bull. Over the next 4.6 years into early August 2020, gold gradually powered 96.2% higher to $2,062. That latest young-and-small secular bull was technically just staked by this summer’s anomalous extreme gold-futures selling. Again huge mean-reversion buying will likely leave this new baby bear short-lived.
So the bull-market years for gold in modern history ran from 2001 to 2012, skipped the intervening bear-market years of 2013 to 2015, then resumed in 2016 to early 2022. These are the years most relevant to understanding gold’s typical seasonal performance throughout the calendar year, including its powerful winter rallies. The exceedingly-bearish gold-futures specs normalizing their lopsided bets would amplify that.
Prevailing gold prices varied greatly through these modern bull years, running from way down at $257 in April 2001 to that latest $2,062 record high in August 2020. To render that enormous range of gold prices spanning two secular bulls perfectly comparable, they must first be converted into like-percentage terms. Only then can these long years of gold prices be averaged together to distill out gold’s bull-market seasonality.
That’s accomplished by individually indexing each calendar year’s gold price action to its final close of the preceding year, which is recast at 100. Then all gold price action of the following year is calculated off that common indexed baseline, normalizing all years regardless of price levels. So gold trading at an indexed level of 110 simply means it has rallied 10% from the prior year’s close, while 95 shows it is down 5%.
This chart averages the individually-indexed full-year gold performances in those bull-market years from 2001 to 2012 and 2016 to 2021. With its bull-bear status uncertain, 2022 isn’t included yet. This bull-market-seasonality methodology reveals that gold’s strongest seasonal rally by far is its winter one which tends to start in late October! That portends big gains in coming months from selloff-depressed gold stocks.
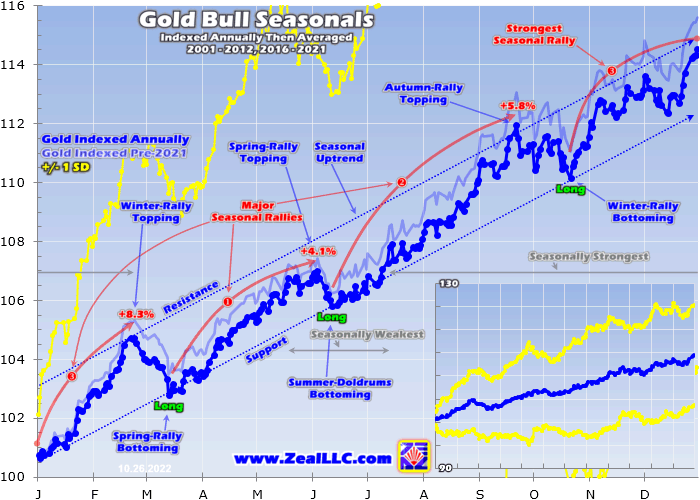
Gold’s average performances during these modern bull years have proven impressive, clocking in with 14.5% gains. And those were dragged lower by a poor 2021, where gold slumped 3.6%. Essentially the same dynamics that have plagued gold this year also dogged it last year. Extreme Fed hawkishness ignited big US-dollar surges, which goaded the hyper-leveraged gold-futures speculators into heavy selling.
Gold actually got off to a strong start in 2022, up 8.1% YTD in mid-April even after that earlier geopolitical spike had faded. That was way ahead of the +4.7% seasonal average at that point. But as Fed officials panicked about the raging inflation unleashed by their own extreme money printing, the wheels starting falling off gold. The Fed embarked on its most-extreme hawkish pivot ever, catapulting the US dollar parabolic.
That prematurely truncated gold’s spring rally, obliterated its usually-stronger autumn rally, and forced the yellow metal into that technical bear market. The magnitude of spec gold-futures selling necessary to fuel such a colossal seasonal deviation was utterly enormous. From March’s earlier geopolitical-spike high, specs dumped a mind-boggling 165.5k long contracts while adding another 66.0k short ones in just 6.6 months!
That added up to staggering gold-equivalent selling of 720.1 metric tons, far too much too fast for global markets to absorb! That hammered gold way down to $1,623 in late September, super-oversold prices last seen emerging from March 2020’s brutal pandemic-lockdown stock panic. That left gold down 11.3% YTD as specs’ capital firepower available for selling dwindled to nothing, dreadfully below typical seasonals.
Normally gold’s autumn rally is cresting in late September, leaving the metal up about 11.9% YTD. That is followed by a short seasonal correction into late October, from which gold’s winter rally launches. This has proven gold’s strongest seasonal rally by far during these modern gold-bull years, averaging hefty 8.3% gains into a late-February peak! That easily bests the spring rally’s +4.1% and autumn rally’s +5.8%.
Even at late October’s winter-rally bottoming before that big seasonal gold demand gets underway, gold has averaged 10.1% YTD gains. Had that happened this year without that epic gold-futures selling, gold would’ve been seeing major seasonal lows in recent weeks around $2,015! But those extreme gold-futures distortions drove terrible underperformance, which greatly ups the odds for an outsized winter rally.
With spec gold-futures selling spent, late September’s deep 2.5-year gold low should prove a durable bottom. From there a seasonal-average 8.3% winter rally would carry gold back up near $1,758. While those are solid gains, that’s not an impressive level absolutely. Gold was running around $1,975 in mid-April before that heavy-to-extreme gold-futures selling erupted, and could surge back up there in coming months.
That would make for a mighty 21.7% winter rally, which is likely too big to be driven solely by gold’s usual big holiday jewelry buying and new-year investing. But the massive gold-futures mean-reversion buying necessary to restore normal spec positioning out of late September’s bearish extremes could easily fuel a rapid 20%+ gold upleg. Again gold soared 21.5% in mid-2019 after the last time spec bets were this lopsided.
To fully return to mid-April spec gold-futures positioning, these traders would have to do 702.8t of gold-equivalent buying. Imagine half that as a mean reversion with no typical overshoot, or about 350t of just gold-futures buying. That doesn’t include the normal winter-rally seasonal demand surges, nor the bigger gold investment buying that arises to chase futures-driven upside momentum. So 350t is really conservative.
Emerging from March 2020’s pandemic-lockdown stock panic the last time gold prices were battered this low, the yellow metal skyrocketed 40.0% higher in just 4.6 months! The total identifiable gold investment buying and gold-futures buying necessary to propel gold in such a big-and-fast move was just 382t. So a 20%+ gold upleg confirming a new bull during coming months’ winter-rally span really isn’t a tall order at all.
Huge self-feeding gold-futures mean-reversion buying is inevitable as this wildly-overextended parabolic US dollar reverses lower. Multiple catalysts could trigger big dollar selling, ranging from US inflation data coming in cooler than expected to accelerating rate hikes by competing major central banks. Once that overdue dollar selling and resulting gold-futures buying gets underway, it has a long way to run to completion.
The battered gold miners’ stocks will be the biggest beneficiaries of a supercharged gold winter rally. This next chart applies this same modern-gold-bull-year seasonality methodology to gold stocks. Since GDX was born later in May 2006, its price history is insufficient for longer-term studies. Thus the classic HUI gold-stock index is used instead. Closely tracking each other, GDX and the HUI are functionally interchangeable.
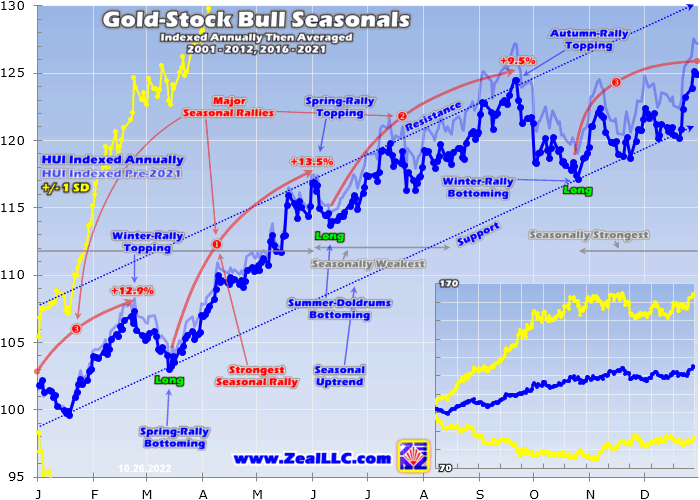
The major gold stocks have solidly leveraged gold’s upside during these same modern-gold-bull years, averaging 25.0% seasonal gains! And those were even better up 27.2% prior to 2021 before these recent serious gold-price distortions from heavy gold-futures selling on Fed hawkishness. Just like the metal that drives their earnings and stock prices, gold stocks enjoy big seasonal spring, autumn, and winter rallies.
Gold stocks’ upcoming winter one averaged 12.9% gains between late October to late February, making it their second-biggest seasonal rally after spring’s +13.5%. Typically at the seasonal-correction bottoming this time of year before their winter rally starts marching, the major GDX and HUI gold stocks are still up 17.2% YTD. But shockingly in late September, GDX had plummeted 31.7% YTD to literal stock-panic levels!
But that colossal seasonal disconnect is an unsustainable extreme anomaly driven by that unsustainable extreme gold-futures selling. As that reverses into big mean-reversion buying catapulting gold sharply higher, the gold stocks will follow and amplify its gains. Normally GDX leverages material gold moves by 2x to 3x. While gold dropped 17.9% between mid-April to late September, GDX collapsed 46.5% or 2.6x.
Gold stocks’ winter-rally potential this year is totally dependent on gold’s fortunes. A merely average 8.3% winter gold rally would drive GDX somewhere between 17% to 25% higher. But the bigger 20%+ one likely on massive gold-futures mean-reversion buying would catapult GDX up 40% to 60%! Those are big gains worth chasing. To end this year with normal seasonal gains, GDX would have to soar near $40.
Though that would make for a huge 83% run off gold stocks’ recent anomalous lows, that would merely return GDX to mid-April levels. Again gold was trading near $1,975 then after that geopolitical spike had passed, with GDX challenging $41. So if the majority of recent months’ enormous gold-futures selling is unwound through mean-reversion buying in this winter-rally span, gold stocks ought to fully recover.
Traders tend to warm to gold stocks in the coming months, as this final chart slicing gold-stock seasonals into calendar months shows. Each is indexed to 100 at the previous month’s final close, then all like months’ indexes are averaged together across these same modern-gold-bull years. Together November, December, January, and February have long proven this sector’s strongest cluster of big seasonal gains.
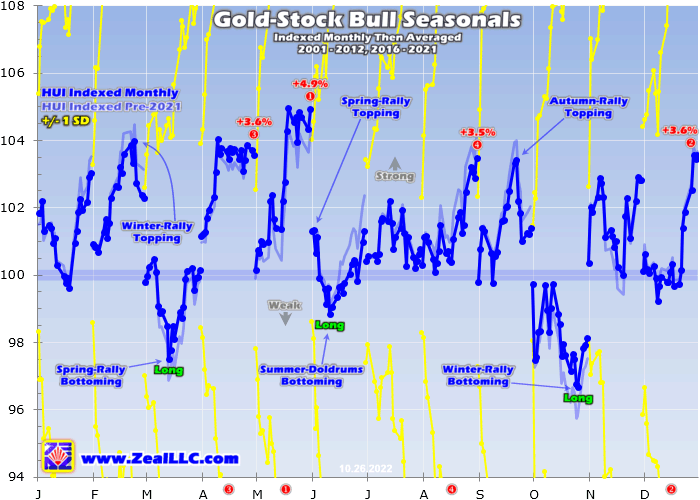
During these upcoming winter-rally months, the HUI has averaged excellent gains of 2.8%, 3.6%, 3.0%, and 2.3% through these long secular spans! While other individual months can see bigger gains, there is no other streak of months enjoying such large and consistent gold-stock rallies. So gold stocks respond very favorably to higher gold prices during its winter rally. Outsized gains are likely this time of the year!
The better gold performs between now and late February, the greater the upside for the beaten-down gold stocks. Unfortunately only a small fraction of contrarians realize this, as this sector’s dreadful recent technical action fueling dismally-bearish sentiment has led traders to abandon gold stocks. Speculators and investors alike need to understand that miserable sector performance is an extreme unsustainable anomaly.
Gold was crushed in mid-2022 by heavy-to-extreme gold-futures selling, driven by the US dollar rocketing parabolic to extreme multi-decade highs. That dollar mania was fueled by extreme hawkishness from Fed officials, both jawboning and aggressive tightening actions. But the shock value of those has passed, setting up the heavily-distorted US dollar and specs’ gold-futures trading to reverse sharply and mean revert.
That will catapult the unloved gold stocks far higher, with GDX amplifying gold’s underlying gains by 2x to 3x like usual. And the smaller fundamentally-superior mid-tier and junior gold miners will way outperform in this coming outsized winter rally. They are better able to consistently grow their outputs, which lowers costs and boosts profitability. These smaller gold miners are in the sweet spot for upside potential as gold runs.
If you regularly enjoy my essays, please support our hard work! For decades we’ve published popular weekly and monthly newsletters focused on contrarian speculation and investment. These essays wouldn’t exist without that revenue. Our newsletters draw on my vast experience, knowledge, wisdom, and ongoing research to explain what’s going on in the markets, why, and how to trade them with specific stocks.
That holistic integrated contrarian approach has proven very successful, yielding massive realized gains during gold uplegs like this overdue next major one. We extensively research gold and silver miners to find cheap fundamentally-superior mid-tiers and juniors with outsized upside potential as gold powers higher. Our trading books are full of them starting to really surge. Subscribe today and get smarter and richer!
The bottom line is gold and thus gold stocks are just entering their strongest seasonal span of the year. Gold’s big winter rally is fueled by outsized demand first from holiday jewelry buying then later new-year investment buying. So both the metal and its miners’ stocks have strong tendencies to rally big between late October to late February. The major gold stocks tend to amplify gold’s underlying gains by 2x to 3x.
And this year’s dawning winter rally has exceptional upside potential after all the gold carnage this year. Gold was hammered to panic-level extreme lows by a half-year of heavy gold-futures selling. But that left speculators’ positioning exceedingly bearish and their selling firepower exhausted, paving the way for massive mean-reversion buying. That should soon catapult gold and gold stocks dramatically higher.
Adam Hamilton, CPA October 28, 2022 Subscribe at www.zealllc.com/subscribe.htm
![]()