![]()
Gold, Silver Very Overbought
Adam Hamilton July 24, 2020 3135 Words
Both gold and silver surged dramatically higher this past week, propelled by torrents of investment capital deluging in. The resulting major new highs are really exciting, unleashing widespread fear-of-missing-out buying. But the precious metals’ blistering jumps have left them very overbought. They have come so far so fast they are at and above technical extremes that have proven unsustainable. So caution is in order here.
Gold and silver are powering higher on balance in secular bull markets that have been running for years. And their fundamental underpinnings are stronger than ever. The Fed’s astoundingly-epic money printing since mid-March’s stock panic has catapulted stock markets to dangerous bubble valuations. And the vast majority of investors have yet to diversify their stock-heavy portfolios with counter-moving precious metals.
Nevertheless, even the strongest of bull markets never move up in nice straight lines. They are always an alternating series of major uplegs then corrections. Bull-market price action looks like a sine wave meandering around a best-fit uptrend line. This flowing-then-ebbing bull-market structure is hugely beneficial to traders, offering plenty of mid-bull opportunities to buy relatively low then later sell relatively high.
This two-steps-forward-one-step-back cadence greatly expands the potential gains bull markets offer. So periodic pullbacks or bigger corrections should be embraced, not feared. Their mission is to rebalance sentiment, bleed off the excess greed ubiquitous late in major uplegs. That prevents bulls from burning out prematurely, sucking in too much future buying too fast exhausting their upside potential. Selloffs are healthy!
Prevailing sentiment, popular greed or fear, is ultimately the arbiter of when bull-market uplegs shift to bull-market corrections and vice versa. While sentiment is ethereal and impossible to measure, it can be inferred. The more bullish traders are on a sector, the more calls for its big gains to extend indefinitely, and the more capital flowing in, the more greedy and even euphoric sentiment is. Excessive greed kills uplegs.
There’s a finite amount of capital available to chase any upleg, adding to its gains. When greed grows potent enough to fuel widespread fear of missing out, much buying is pulled forward from coming weeks and months. That soon exhausts available capital firepower to keep driving prices higher, leaving a void of demand. With enthusiastic buyers effectively all-in, the balance of capital-flow power shifts to sellers.
Since traders’ herd psychology drives buying and selling, which moves prices, sentiment is also evident in price action. Overboughtness is a hard empirical technical measure of how fast prices have rallied. As bull-market uplegs start peaking, prices surge too far too fast to be sustainable. This week warnings are flashing that gold and silver are entering that precarious state, where odds increasingly favor imminent selloffs.
Overboughtness can be measured many ways, but I’ve long preferred the simple approach of looking at prices relative to their trailing 200-day moving averages. I developed a trading system based on this over 15 years ago called Relativity Trading, which I’ve been refining since. It considers prices as multiples of their 200dmas. These tend to form horizontal trading ranges over time, which are very profitable to exploit.
200dmas, the average closes of the last 200 trading days, make ideal technical baselines from which to measure how far and fast prices have rallied. 200dmas aren’t static, so they are never rendered obsolete by changing prevailing price levels. Instead 200dmas are dynamic, constantly adapting to differing prices. But they change so gradually that outsized price moves really stand out compared to these key baselines.
Relative gold, which I shorten to rGold, is simply gold’s daily close divided by its 200dma. Gold finished at $1868.00 on Wednesday, the data cutoff for this essay. Its 200dma that day was $1610.27. Divide the former by the latter, and the rGold multiple was running 1.160x in the middle of this week. Of course that is meaningless without context. But chart daily rGold levels over years, and overboughtness leaps out.
This Relatively chart superimposes gold’s technicals over that rGold multiple since just after this secular gold bull started marching higher in mid-December 2015. This type of chart effectively flattens out that 200dma baseline to 1.00x, which the relative multiple meanders around in constant-percentage terms which are perfectly comparable regardless of prevailing price levels. Gold is extremely overbought today!
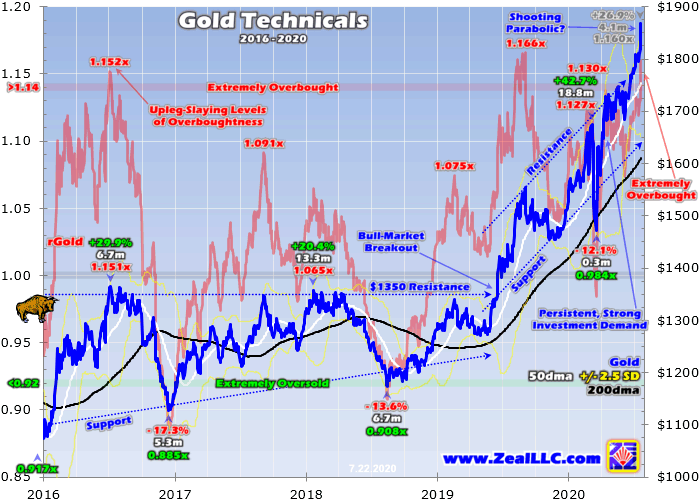
For my own trading purposes, I base Relativity trading ranges off the past 5 calendar years. These are updated once annually, late each year. The current rGold trading range of 0.92x to 1.14x is based off all gold’s price action from 2015 to 2019. Gold trading less than 92% of its 200dma is extremely oversold, marking major correction bottomings. Gold over 114% is extremely overbought, flagging major upleg toppings.
Again rGold surged to 1.160x in the middle of this week, well above the upper band of its trading range. Since mid-March’s stock panic, massive investment demand has blasted gold 26.9% higher in just 4.1 months! That’s a lot of rallying in a short period of time, fueling greedy euphoric sentiment manifesting as extreme overboughtness. This doesn’t mean gold’s upleg will imminently fail, but odds of that are very high.
The last time gold was so stretched technically was early September 2019, after gold powered up 32.4% in 12.6 months in a strong upleg. That pushed rGold up to 1.166x, only slightly more overbought than this week. Gold had surged too far too fast to be sustainable, sucking in too much near-future buying which exhausted that capital firepower. What happened next? Gold indeed retreated 6.4% over the next 2.7 months.
That was just a minor pullback-grade selloff, under 10%. Larger corrections run 10% to 20%, and new bear markets are born over 20%. Smaller pullbacks also rebalance sentiment, but to a lesser degree than corrections. But don’t underestimate the pain a 6% gold pullback would cause. From this Wednesday’s close, that would force gold back down to $1756. And remember gold stocks amplify gold’s downside.
The leading and dominant GDX VanEck Vectors Gold Miners ETF tends to leverage material gold moves by 2x to 3x. So a 6% gold pullback tends to hammer the major gold stocks 12% to 18% lower. And some smaller mid-tier gold miners with superior fundamentals have even more leverage to gold, which acts like a double-edged sword in gold selloffs. So even a fairly-shallow and short gold pullback is risky for traders.
In my line of work as a newsletter guy, I receive lots of feedback which offers a unique read on prevailing sentiment. This week I’ve been swamped with requests for very-expensive consulting time to help people build gold-stock and silver-stock portfolios right now. The fear of missing out is so great they want to buy high, risks be damned. I’ve seen this phenomenon at past major gold toppings too, people rushing to chase.
Achieving success in this challenging speculation game demands buying low then selling high. The time to buy gold, silver, and their miners’ stocks low is when they have just been crushed deeply under their own 200dmas. In our newsletters we started aggressively adding new gold-stock and silver-stock trades right after mid-March’s stock panic pummeled them to absurd lows. The gains since have been enormous.
As April dawned I wrote an essay on gold stocks’ crash and V-bounce, concluding “the gold stocks will power far higher.” The day that essay was published, GDX closed at $24.95. And 3.6 months later this Wednesday, it closed at $41.75 which is 67.3% higher. This upleg’s easy buy-low gains have already been won. It is very risky deploying heavily in gold and gold stocks when they get extremely overbought.
And a mere gold pullback out of super-overbought conditions is the best-case scenario. This secular gold bull’s only other extreme rGold reading came back in early July 2016 after its maiden upleg. Gold soared 29.9% higher in just 6.7 months, stretching as high as 1.152x its 200dma. The resulting euphoria and fear of missing out was great then, like today. Traders were universally calling for far-higher prices just ahead.
But gold had rallied too far too fast, sucking in and exhausting all-available near-future buying. That left gold at the mercy of a healthy bull-market correction, which grew severe due to unique market conditions at the time. Trump’s surprise election victory unleashed taxphoria stock buying on tax-cut hopes, which propelled stock markets dramatically higher. That devastated demand for alternative investments led by gold.
Over the next 5.3 months, gold plunged 17.3%! While I certainly don’t expect such an outsized selloff today given current market conditions, 17% would crush this metal way back down to $1550. And the major gold stocks would amplify that by 2x to 3x. Why anyone would want to add material new positions in gold stocks when gold is extremely overbought is beyond me. The risk-reward ratio buying really high is poor.
Gold is extremely overbought because it has soared 4.9% month-to-date in July. Annualizing that shows how unsustainable such blistering gains are, gold is blasting higher at an 82% yearly pace! But boy gold looks tame compared to silver. Silver has skyrocketed 26.2% in this month alone, annualizing to a jaw-dropping 440% appreciation rate! Not even highly-volatile silver can sustain such stratospheric upside for long.
This next chart applies this same Relativity methodology to silver, yielding rSilver. Its trading range over the past 5 calendar years from 2015 to 2019 is running 0.90x to 1.25x. Silver is oversold and cheap way down at 90% of its 200dma, but overbought and expensive above 125% of that baseline. In the middle of this week, that rSilver multiple soared to a new secular-bull high of 1.352x! That is extremely overbought.
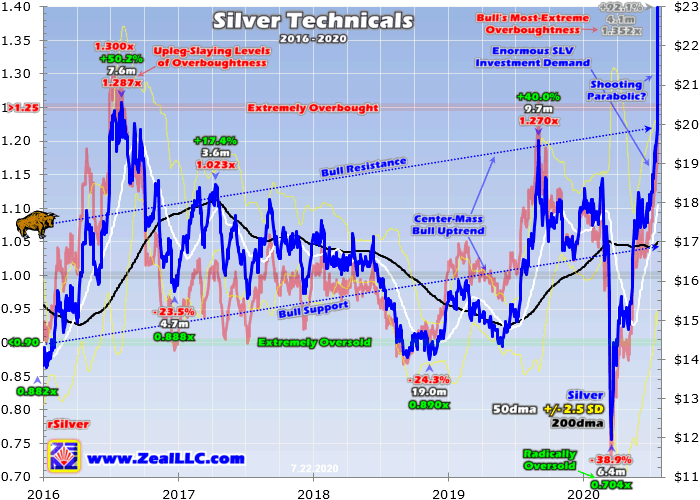
Since mid-March’s stock panic obliterated silver to ridiculous all-time lows compared to prevailing gold prices, silver has skyrocketed 92.1% higher in 4.1 months! And silver sure looks to be shooting parabolic in July’s slice of this massive upleg, everything north of $18. That has been fueled by enormous demand for silver’s dominant exchange-traded fund, the SLV iShares Silver Trust. Silver investment has exploded.
But that has catapulted silver an astounding 1.352x above its key 200dma technical baseline! Such extreme overboughtness is unprecedented within this silver bull. Since silver is so incredibly volatile, its bull and bear markets are usually considered from those of its overwhelming primary driver which is gold. During the past 5 years or so, silver has only seen two other overboughtness extremes anywhere near today’s.
Back in early September 2019 silver peaked concurrently with gold, after rSilver had surged to 1.270x. Like gold silver had soared too far too fast to be sustainable, exhausting then-available capital firepower for buying. So over the next 3.1 months silver retreated a fairly-mild-for-it 15.5% to bleed off excessive greed and rebalance sentiment. 15% off silver’s current mid-week high would force it back down to $19.52.
The only other time silver was driven to extremely-overbought levels in this bull by fear-of-missing-out euphoric buying was summer 2016. rSilver skyrocketed as high as 1.300x as this gold bull’s maiden upleg was peaking, and was still up at 1.287x the day silver topped in early August that year. There was nothing wrong with silver fundamentally, but that extreme overboughtness had to be remedied through a selloff.
Silver indeed dropped 23.5% over the next 4.7 months. A similar selloff today would hammer silver all the way back down to $17.57. It just isn’t prudent to add new silver and silver-stock positions when silver is extremely overbought. While it may keep rallying for a spell, the odds increasingly favor imminent big selloffs to restore balance. Just like anything, the time to add silver positions is when it is low relative to its 200dma.
The masthead of our weekly newsletter apes my favorite Warren Buffett quote, “Brave When Others Are Afraid, Afraid When Others Are Brave”. That’s the principle to live by when trading gold, silver, and their miners’ stocks. If everyone else is excited to buy high, greed is rampant, and euphoric fear of missing out is the popular outlook, then it is best to sit out. Being afraid when others are brave precludes buying high.
Back in mid-April when silver was trading near $15, I wrote an essay on the “Big Silver Bull Running!” I urged traders to aggressively buy fundamentally-superior major silver miners’ stocks, which were still very cheap then. I concluded “A massive bull run is likely again after last month’s panic.” As usual being a contrarian fighting the herd, I got plenty of flak for that outlook. That is being brave when others are afraid.
I’ve often advised our subscribers over the decades that buying low and selling high requires feeling bad when doing it. If you are eager to buy gold, silver, and their miners’ stocks, you are doing it at the wrong time! Traders only like the precious-metals sector after it has surged. To buy low you have to do it when it feels miserable, when this sector is shunned and beaten-down. Gold and silver certainly look toppy today.
That doesn’t mean their strong post-panic uplegs will fail tomorrow. Self-reinforcing momentum buying can sometimes extend considerably longer than most expect. The higher gold and silver run, the more investors want to buy in to chase those gains. The more capital they deploy, the higher gold and silver go. So extreme-overboughtness reads aren’t necessarily calling tops, but warning that their odds are soaring.
Interestingly millennial traders may help decide when gold and silver roll over into healthy bull selloffs after their strong uplegs. These young people tend to flock to Robinhood, the popular app that pioneered commission-free stock trading. That company instead makes money by selling its users’ order-flow data to high-frequency-trading firms, which program their computers to instantly front run millennials’ collective trading.
Robinhood publishes data on how many of its users own particular stocks. Back in mid-March when gold and silver were bottoming in the epic fear of that COVID-19-lockdown-spawned stock panic, there were about 14k users holding the leading and dominant GLD SPDR Gold Shares gold ETF and under 8k in SLV. As of this week those numbers have roughly doubled to over 28k and nearly 20k respectively.
GLD’s millennial buying per Robinhood has been relatively consistent since the panic, but SLV’s has shot parabolic in recent weeks with silver prices. Robinhooders are notorious for being a momentum-driven herd. They flood in when prices are surging looking for fast gains, but quickly abandon stocks to move on to other hot ones when that upside flags. So they could exit GLD and especially SLV fast as gains stall.
That would exacerbate gold and silver downside in their next selloffs. But again realize that pullbacks and corrections are essential to keep bull markets healthy. Sentiment must be rebalanced after greed grows excessive, bleeding off euphoria and restoring normal psychology. Mid-bull selloffs are very valuable for traders, leading to the best buy-low opportunities within ongoing bull markets. That really boosts ultimate gains.
Pullbacks and corrections are entirely a sentiment and technical thing, and have nothing at all to do with fundamentals. These gold and silver bulls will continue marching after these selloffs necessitated by this extreme overboughtness pass. Between mid-March to early June, the Fed’s balance sheet skyrocketed 66.3% higher on epic record money printing as Fed officials panicked to try and stave off a full-blown depression!
With the US dollar supply ballooning 2/3rds higher in just several months, colossal monetary inflation is baked into the system which is really bullish for gold. That flood of liquidity blasted stock markets higher, leaving the 500 elite companies of the flagship S&P 500 trading at dangerous near-bubble trailing-twelve-month price-to-earnings ratios averaging 27.8x heading into July. That portends a major stock-market selloff.
That will really boost already-strong gold investment demand. American stock investors remain woefully underinvested in this outstanding portfolio diversifier. At the end of June, the total value of GLD’s bullion holdings was just 0.2% of the S&P 500’s collective market capitalization! Every investor always needs a 10%-to-20% gold allocation in their portfolios, which acts as insurance balancing out stocks’ downside risks.
And silver still needs to mean revert dramatically higher relative to gold, to regain historic norms in this key relationship. But a full reversion and overshoot happen over a bull market, not within a single upleg. Bull markets are an alternating series of uplegs followed by corrections, two steps forward then one step back. These ebbings are just as important as the flowings to ensure bulls eventually reach their best potential.
With gold and silver both extremely overbought according to their own secular-bull precedents, I wouldn’t rush to add new precious-metals positions way up here. While today’s gold and silver uplegs could defy the odds and keep powering higher, buying high is way too risky. It is wiser to stay in cash and wait for the inevitable pullbacks or corrections after extreme-overbought readings, delaying to buy in relatively low.
For traders who already prudently bought precious-metals positions low earlier in major uplegs before they grew extremely overbought, these technical warnings don’t necessarily demand selling. Instead they can be used to ratchet up trailing-stop-loss percentages. That lets traders stay in profitable trades as long as possible to ride their upside momentum, preserving more of their unrealized gains when those uplegs fail.
At Zeal we started aggressively buying and recommending fundamentally-superior gold and silver miners in our weekly and monthly subscription newsletters back in mid-March right after the stock-panic lows. We layered into many new positions before this overboughtness, with unrealized gains already growing as big as +211%! Our trading books are full of fundamentally-thriving gold and silver miners that are still running.
To profitably trade high-potential gold and silver stocks, you need to stay informed about what’s driving gold and silver. Our newsletters are a great way, easy to read and affordable. They draw on my vast experience, knowledge, wisdom, and ongoing research to explain what’s going on in the markets, why, and how to trade them with specific stocks. Subscribe today and take advantage of our 20%-off sale! The only way to catch buy-low and sell-high periods in real-time is always staying attuned to market action.
The bottom line is gold and silver are extremely overbought today. Popular sentiment has grown greedy and euphoric, with fear-of-missing-out buying flaring dramatically. That has forced both gold and silver to very-stretched levels relative to their baseline 200dmas. Such extremes have warned of uplegs topping in these bull markets, heralding rebalancing selloffs ranging from fairly-mild pullbacks to severe corrections.
These essential selloffs erupting periodically in all bull markets should be embraced. They offer the best buy-low opportunities ever seen within ongoing bulls. They also keep bulls healthy, helping to maximize their ultimate durations and gains. Extreme overboughtness warns traders to prepare for essential retreats after prices charge higher. Stop losses can be ratcheted tighter, preserving bigger gains when selloffs emerge.
Adam Hamilton, CPA July 24, 2020 Subscribe at www.zealllc.com/subscribe.htm
![]()