![]()
Gold-Futures Selloff Wanes
Adam Hamilton April 25, 2014 2837 Words
Gold’s sharp selloffs since mid-March have been mostly driven by American futures speculators’ heavy selling. These traders dramatically slashed their long bets on gold while ramping up their shorts. The resulting deluge of supply flooded the market and temporarily overwhelmed demand. But intense bouts of gold-futures selling quickly burn themselves out, and today’s is waning. Thus gold’s upleg is due to resume.
While many stock traders view the gold market through the lens of the mighty GLD SPDR Gold Shares ETF, it is still gold-futures trading that usually dominates price action. While GLD certainly can move the gold price on trading days with particularly large builds or draws from differential GLD-share buying or selling, these are fairly rare. The vast majority of the time gold and therefore GLD are driven by futures.
While the very successful GLD ETF was born in late 2004, American gold futures started trading three decades earlier in late 1974. That’s when gold ownership finally became legal again in the United States. Over the great gulf of time since, the US gold-futures price gradually became the global standard for measuring gold. Everything else, including GLD share prices, cues off what is happening in gold futures.
And it is the American speculators who dominate US gold-futures action. They are constantly buying and selling gold futures based on sentiment, technicals, and news. When their buying or selling grows lopsided, gold moves accordingly. While the total numbers of long and short gold-futures bets are always perfectly equal in the zero-sum futures game, the speculators (as opposed to the hedgers) drive the trading.
They’ve been very bearish on gold since mid-March. That was soon after Ukraine’s geopolitical crisis hijacked a young gold upleg. Between the mid-December gold bottom right after the Federal Reserve started to taper its third quantitative-easing campaign and late February, gold powered 12.7% higher to $1340. Crimea didn’t first make the news, traders hadn’t even heard about it yet, until several days after that!
The Ukraine tensions amplified gold’s gains in early March, driving it to $1383 by mid-month. But right after that the Crimean people overwhelmingly voted to secede and join Russia. The very next trading day, gold started selling off. Despite Russia continuing to mass troops, armor, and artillery along Ukraine’s border, the American futures speculators figured Russia taking Crimea would magically resolve that crisis.
So they sold gold futures, driving the gold price and those of all the gold tracking ETFs led by GLD lower. Since futures are such a highly-leveraged hyper-risky game, this selling fed on itself. Speculators only need to keep $6500 in their margin accounts to control a single 100-ounce gold-futures contract! And at $1300 gold that’s worth $130k. Running extreme 20x leverage to gold doesn’t leave any wiggle room at all.
So futures selling begat more futures selling, flooding the market with supply that kept coming even as Ukraine quickly started to heat up again. And the resulting gold weakness dragged down GLD share prices and spawned high levels of bearishness. But this process is waning, as American speculators have already dumped so many long-side gold contracts that their total longs are now about as low as they’re likely to go.
My charts this week illustrate this high-odds imminent gold reversal that will be driven by American speculators’ futures selling petering out. The green line shows the total long-side gold contracts this group of traders holds, and the red line their total short-side gold contracts. These key metrics have very high positive and negative correlations respectively with the gold price, which is shown here in GLD terms in blue.
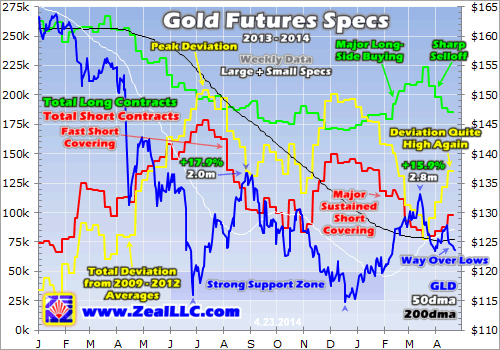
Gold and GLD price levels are dominated by US gold-futures trading! Gold rises when speculators buy gold futures, both in the form of adding new long-side contracts and covering existing short-side ones. The last episode of heavy gold-futures buying happened in January and February. Speculators first bought to cover shorts, and later bought to open longs. And GLD prices surged dramatically as a result.
Exactly the opposite has happened since mid-March, when speculator futures buying shifted to selling. GLD fell as speculators sold through both liquidating existing long contracts and adding new short ones. The resulting deluge of new gold supply overwhelmed normal investment demand, so gold’s price fell on balance. But this heavy selling, particularly on the critical long side, is waning after burning itself out.
Some essential context makes American speculators’ total long and short gold-futures bets much easier to interpret. 2013 was an extremely anomalous year for gold. Not only was it gold’s worst year in nearly a third of a century, the precipitous plunge last April led to gold’s worst quarter in an astounding 93 years! There was absolutely nothing normal about the gold markets last year, they were off-the-charts crazy.
So to understand how speculators’ gold-futures bets in this chart stack up historically, we need some normal baseline. The most logical one is the period from 2009 to 2012, which was after 2008’s once-in-a-century stock panic and before 2013’s once-in-a-lifetime gold panic for lack of a better term. Averaging the total gold-futures longs and shorts held by American speculators over that 4-year span yields a normal baseline.
They held 288.5k long-side gold contracts and 65.4k short-side ones on average, during that long secular slice of time that included both massive gold uplegs and brutal corrections. As of the latest weekly Commitments of Traders report that discloses their gold-futures holdings, speculators were down to just 185.8k long-side contracts and up to 98.2k short-side ones. They remain far more bearish than normal.
To streamline this analysis, I added up the weekly deviation from those 2009-to-2012 average levels of both longs and shorts. It is rendered above in yellow. Note the nearly perfect inverse correlation between this deviation and the GLD price in blue. GLD sells off when this bearish deviation from norms rises, and rallies when it retreats. This ironclad relationship is why GLD traders have to follow gold futures!
GLD prices surged dramatically in February and early March primarily because futures speculators were buying gold through adding longs and covering shorts. This is readily evident in the weekly CoT data on their total long and short positions shown above. These reports are current to each Tuesday’s close, so in CoT terms GLD rallied 8.0% between February 4th and March 18th on heavy gold-futures buying.
During that 6-week span speculators bought a staggering 80.2k gold-futures contracts! 44.1k were new long positions, while 36.0k were covered shorts. This averages out to 13.4k contracts being bought per week when GLD surged, or the equivalent of 41.5 metric tons of gold bought every week. So much marginal futures demand on top of normal investment demand quickly catapulted gold and therefore GLD prices higher.
This was massive futures gold buying! According to the World Gold Council, total global investment demand for gold averaged 30.2t per week in 2012 and 14.9t per week in 2013. Last year’s number was so low only because of the epic differential selling pressure American stock traders put on GLD, forcing it to hemorrhage 40.9% of its holdings. Outside of ETF selling, 2013’s gold investment demand hit an all-time record high.
So with normal investment demand being on the order of 30.2t per week, you can see why an additional 41.5t of gold-futures buying can catapult the gold price up so fast. But unfortunately after the Ukraine crisis hijacked psychology among gold-futures traders, they started hammering their sell buttons again. Between the CoT Tuesdays of March 18th and April 15th, GLD share prices lost 3.9% on futures selling.
During that 4-week span ending at the latest CoT report, American futures speculators sold 58.3k contracts through both liquidating longs and adding shorts. This works out to a weekly rate of 14.6k contracts, or the equivalent of 45.4t of new gold supply hitting the markets weekly. Obviously that is enough to even overwhelm 2012’s average weekly investment demand of 30.2t, so gold prices naturally fell dramatically.
But for several key reasons, I suspect this episode of heavy gold-futures selling is either waning or over. The rate of the long liquidation has moderated dramatically, with speculators’ total longs back down near major 2013 lows where gold launched. The recent short ramp is relatively minor too, suggesting much less bearish conviction among traders. And gold has been finding support near its 200-day moving average.
Let’s start with the longs. Futures speculators’ aggregate bets are a fantastic contrarian indicator for gold. Without fail historically, the lower their long-side bets and the higher their short-side ones, the more likely gold has carved a durable bottom and is on the verge of a major new upleg. Those uplegs are initially sparked and fueled by short covering, then new long buying, and then other gold investment demand takes over.
You can see this progression above, gold started surging in January on big futures short covering and then accelerated in February on new long buying. When these long bets start rising again after their latest pullback, gold is going to resume rallying. And we are nearing or at that point. Notice above how the green speculators’ total-longs decline is moderating dramatically. This long liquidation has run its course.
Over the past 4 CoT weeks of this gold selloff, speculators reduced their long-side gold-futures bets by 15.7k, 9.5k, 9.1k, and then 3.5k contracts sequentially. This latest CoT week saw long-side futures gold selling at less than a quarter of the initial week’s wave! Without long liquidations, gold will start rising again on other investment demand which will force the highly-leveraged futures shorts to buy to cover.
And this latest CoT week’s total speculator longs of just 185.8k contracts is extremely low and totally unsustainable. It isn’t too far above the absolute low of 170.2k seen in mid-December when peak gold despair hit. At that point futures speculators were as bearish on gold as they’d been since the stock panic fully 5 years earlier. And out of that earlier short-lived bearish sentiment extreme, gold would soar.
This next chart extends this gold-futures CoT data on speculators’ total long and short bets back to that stock-panic year of 2008. Gold itself replaces GLD as the blue line. Not only are such low levels of total speculator gold-futures longs unsustainable and short-lived, after that stock-panic episode gold would blast 166.5% higher over the next several years! Extreme futures bearishness births massive gold uplegs.
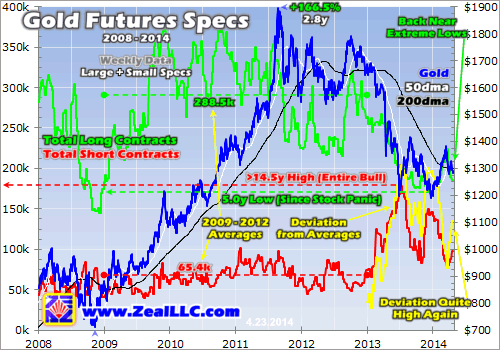
2013 was gold’s worst year in nearly a third of a century, and bearishness was as high as I’ve seen it in my trading lifetime. There is absolutely nothing that could happen to gold this year that would even remotely approach such an epic swing to bearishness. And as the first chart shows more clearly, even throughout that entire despairing second half of 2013, speculators’ total longs rarely fell below 175k contracts.
Their strong support zone, the point where futures speculators stopped liquidating longs even when gold kept grinding lower, ran between 175k and 185k contracts. That’s right where they are again today! And if all the extreme gold carnage of last year couldn’t force their long-side bets lower, it is really hard to imagine that support breaking this year. That means the only thing speculators can do now is start buying again.
And on the short side, the recent ramp up is relatively minor too. While the long-side liquidation erased most of February’s buying, the short surge in the past month barely carried total shorts back to late-February levels. That suggests futures speculators aren’t as convicted on the bearish case for gold as they wrongly were in late 2013. And they sure shouldn’t be after gold’s strong rally earlier this year, pre-Ukraine.
So when gold starts rallying again as the long-side liquidations stop and reverse to buying, odds are the traders on the short side will be quicker to cover. They’ve seen gold rally powerfully in early 2014, carve a strong Golden Cross technical buy signal, and then stabilize near gold’s 200dma which has turned higher again. Not even the torrent of futures selling could force gold back down to retest late-2013 lows.
At 20x leverage to gold on maximum margin, gold only has to rally a few percent to make all the new shorts really nervous. And over 1/5th of the speculators’ current gold-futures short positions were added in the last month alone! They’ve bet against gold despite its strong upleg in 2014, and they will buy to cover fast when gold starts moving decisively higher again. Short covering always feeds on itself too.
And once we see the equivalent of 45.4t of weekly futures selling slow and then reverse, gold is going to fly again. The fact that this metal bounced in early April in the face of that heavy futures selling, rather than falling back down near $1200, shows strong physical demand somewhere in the world. It will certainly push gold higher again as the heavy futures selling unleashing the deluge of gold supply abates.
And both gold-futures buying and GLD differential buying pressure are going to be big parts of gold’s accelerating upleg. As of that latest CoT report, speculators’ total longs are still 102.7k contracts below their 2009-to-2012 average levels in normal markets. That is the equivalent of 319.5t of gold buying merely to mean revert! And shorts were 32.8k above their normal average, another 102.0t of guaranteed futures buying.
So merely to unwind 2013’s extreme gold-futures anomalies, not even to overshoot towards the opposite extreme as mean reversions always do, futures traders are going to have to purchase the equivalent of 421.5t of gold. Since futures are so highly-leveraged and risky, mean reversions are often fairly rapid like we saw in 2009. So if this next one takes a year, futures traders will add 8.1t of average weekly gold demand.
And GLD’s holdings were crushed last year by that record mass exodus from its shares. As gold’s new upleg resumes on futures buying, and the wildly-overvalued US stock markets inevitably roll over, stock investors will once again be attracted to gold. If they even restore half the GLD positions they sold last year over the coming year, that is another 276.3t of new gold investment demand! That would add 5.3t weekly.
So the prospects for gold soaring in the coming year on mean reversions in speculators’ gold-futures positions and stock investors’ GLD positions are amazing. And with the heavy futures selling of the past month already waning, this new investment demand should begin soon. Ironically it may actually be the same Ukraine crisis that futures speculators wrongly assumed was over that soon reignites major gold buying!
Russia never backed down even after winning Crimea, continuing to mass a huge invasion force along Ukraine’s border. Ukraine has even proved that some of the same individual Russian special-forces insurgency operatives that fomented the Crimea uprising are active in eastern Ukraine. And Russia has all but threatened to invade Ukraine if that country takes any action to stop the Russian-soldier-led revolution!
Gold certainly doesn’t need a geopolitical boost to rally, as its strong early-2014 upleg proved. But Russia invading or annexing more of Ukraine certainly wouldn’t hurt gold demand either. Are you ready for this mean-reversion upleg in gold to resume? While gold and GLD will do great, the gains in the loathed gold and silver miners will dwarf those of the metals. They are the ultimate contrarian bet today.
At Zeal we are constantly researching gold and silver stocks to uncover the fundamental elites with the best chances to soar. We periodically publish in-depth profiles of the winners in comprehensive reports. Every investor ought to have a position in the deeply out-of-favor and radically-undervalued gold and silver miners today. Purchase our popular reports, and you can quickly get up to speed on the best ones to own.
We also share our decades of hard-won experience, knowledge, wisdom, and ongoing research in acclaimed weekly and monthly contrarian newsletters. In them I explain what is going on in the markets, why, and how we are currently trading them with specific stock trades. Since 2001, all 664 recommended in our newsletters have averaged stellar annualized realized gains of +25.7%! Join us today and start growing and profiting as a contrarian.
The bottom line is the heavy futures selling that hammered gold in the past month has likely run its course. Speculators’ aggressive liquidation of their gold-futures longs left their total positions down near major lows. Not even the once-in-a-lifetime extreme bearishness of late last year could push them much lower, which means this selling is likely done. That ends, and the new shorts will be forced to quickly cover.
And the great majority of last year’s extreme deviation of speculators’ futures positions from normal levels still has yet to be unwound. Their long-side bets are still way too low, and their short-side ones remain too high. These positions will continue to mean revert, and eventually overshoot, their normal averages. This heavy futures buying will add major gold investment demand, greatly amplifying gold’s upleg.
Adam Hamilton, CPA April 25, 2014 Subscribe at www.zealllc.com/subscribe.htm
![]()