![]()
Weak SPX Technicals
Adam Hamilton May 27, 2011 2314 Words
While the stock markets have enjoyed an outstanding busy season, the dreaded summer doldrums are now upon us. This vacation season usually heralds listlessly-grinding markets, sometimes significant selloffs, and rarely meaningful rallies. The stock-market technicals heading into summer greatly influence which outcome is most likely in these coming lethargic months.
Of course the flagship S&P 500 stock index (SPX) is the best technical proxy for the stock markets as a whole. This market-capitalization-weighted behemoth has been around for over a half-century. It tracks the 500 biggest and best American companies, with a staggering collective value in the marketplace around $12.4 trillion dollars! It is the definitive benchmark against which fund managers measure their performances.
The stock-market busy season runs from Labor Day to Memorial Day, early September to late May. The SPX’s performance over this latest span has been awesome. After being deeply oversold in late August, paralyzed by irrational crash fears like that silly Hindenburg Omen indicator, the SPX started rallying sharply as I predicted at the time. By late April, it had powered 30.2% higher in 8 months!
It was a heck of an upleg, no doubt. But the stock markets perpetually flow and ebb, mighty uplegs are followed by sharp corrections or long consolidations. These are healthy and necessary to rebalance sentiment. After the stock markets have risen relentlessly for a long time, greed and complacency dominate trader psychology. But emotional extremes never last long, as they naturally burn themselves out.
Once that happens, the great sentiment pendulum starts swinging the other way. And it seldom stops until it gets to the opposite extreme in its arc, in this case fear and anxiety. Almost all short-term stock-market action can be distilled down into endless greed-fear cycles, the pendulum forever swinging back and forth between greed and fear. This dynamic is simple and easy to understand.
Traders gradually bid up stock prices, and after enough rallying greed grows. But eventually prices get so overbought that all traders interested in buying anytime soon have already bought. So only sellers remain, and once their selling pressure starts driving prices lower it scares others to sell. Eventually this feedback loop leaves prices so oversold that everyone interested in selling soon is already out, fear peaks. Only buyers remain, and their buying pressure once again pushes prices higher, attracting more buyers.
The key to successful investing and speculating is to fight the crowd, do the contrarian thing. When others are already greedy because prices are high after an upleg, sell. As Warren Buffett wisely says, be afraid when others are brave. And then when others are scared because prices are low after a correction, buy. Be brave when others are afraid. While simple conceptually, this discipline demands self emotional mastery.
So where are the stock markets in their greed-fear cycles today? The SPX technicals can help answer this critical question as we head into summer, which tends to be weak seasonally. This chart shows the SPX trading action during the past couple years’ cyclical bull. A second series, the Relative SPX, is explained below. Understand this chart and its implications, and you will radically improve your odds of making the right trading decisions this summer.
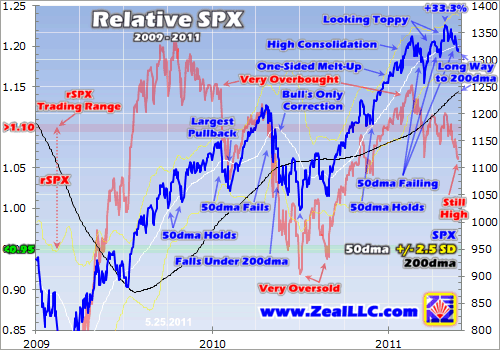
Since this busy season began early last September, the SPX has soared powerfully. And much of this upleg, especially in early 2011, was very one-sided. The stock markets rallied for days on end, a melt-up with few down days to keep greed and complacency from growing overwhelming. But back in mid-February, this seemingly-impregnable advance suddenly stalled on news of the Libyan revolt.
Anything could have been the catalyst to arrest that long-in-the-tooth upleg though, it doesn’t take much to turn an overbought market south. And the SPX was certainly overbought! One way to measure this is by comparing the SPX to its 200-day moving average. 200dmas form a gradually-evolving baseline from which prevailing price levels can be measured. Once an upleg stretches too far above its 200dma, its days are numbered.
This relationship between prices and their 200dmas is the basis of my Relativity trading system. Learn it and you will have vastly greater success in buying low and selling high! It simply takes any price and divides it by its own 200dma. The resulting multiple distills this critical relationship into constant-percentage terms that are perfectly comparable over time. Even better, these multiples tend to form horizontal trading ranges, a price tends to trade in a well-defined band relative to its own 200dma.
The Relative SPX (rSPX) multiple is shown above in light red, slaved to the left axis. Over the past 5 years or so, lopping off the anomalous extremes driven by 2008’s once-in-a-century stock panic, the SPX has tended to trade between 0.95x to 1.10x its 200dma. When on the low side of this range it is oversold, the time to buy as stock prices are relatively cheap. When on the high side it is overbought, the time to sell as stock prices are relatively expensive.
At that mid-February peak the rSPX ran 1.152x, which was very overbought. The SPX had stretched 15.2% above its black 200dma line. This is readily apparent above. Look at the left axis and visualize the black 200dma line as flattened to horizontal at 1.00x, and the blue SPX line as a multiple of this baseline rendered in light red. So far in this cyclical bull, the stock markets haven’t done well after 1.10x was exceeded.
Of course the wild stock-panic-driven gyrations battered this indicator about like all other indicators. But once the SPX started stabilizing after the panic, the rSPX grew overbought. The result was the largest pullback (less than 10% selloff) in this entire bull in early 2010. But the SPX didn’t correct fully and was soon stretched 10%+ above its 200dma again by April 2010. These overbought conditions resolved themselves through the only correction (greater than 10% selloff) of this entire bull late last spring.
When markets get overbought, selloffs are the best and quickest way to resolve the sentiment imbalance. Greed and anxiety are rapidly obliterated by rapidly-falling stock prices. But a secondary way is through a sideways grind, a consolidation. And that is exactly what we’ve seen in the several months since that mid-February peak. The stock markets have just drifted sideways on balance, gradually eroding greed and ramping up anxiety. Consolidations take much longer to rebalance sentiment, delaying the next buying op.
There was a minor pullback during this consolidation, the SPX fell 6.4% by mid-March as the Japanese earthquake/tsunami/nuclear fears peaked. After that the stock markets staged a rally during Q1 earnings season, but it was relatively minor. At best at the end of April, the SPX was still merely 1.5% above its mid-February peak achieved almost 10 weeks earlier. The stock markets are definitely mired in a high consolidation!
These sideways grinds really wear on bullish traders. They see all kinds of good news, like blowout earnings for high-profile companies and improving economic data, yet the stock markets fail to rally in response. Gradually this morphs their smug greed seen at the initial peak into anxiety. Sideways-grinding markets look increasingly toppy as time marches on, ratcheting up the psychological pressure to sell.
Even worse technically, consolidation drifts compress the SPX ever closer to its key 50-day moving average. 50dmas are super-important technically because they are where pullbacks within ongoing bulls tend to bounce. Corrections, on the other hand, slice through the 50dma and often plunge all the way back down to the 200dma before they fully run their course. So once the SPX falls below its 50dma, it enters a technical no man’s land where a bigger correction is probable.
During this recent high consolidation, the SPX’s white 50dma line above has failed on three separate occasions. Though it was able to bounce back over this key metric after the first two, the second rally on that earnings-season bump was much more anemic than the first. This is making technically-oriented traders a lot more worried about today’s third 50dma failure. If the stock markets don’t surge back above this critical line in the sand soon, selling pressure is going to accelerate.
Remember that the stock-market sentiment responsible for nearly all short-term price action perpetually oscillates back and forth between greed and fear. Greed peaks when the SPX stretches far above its 200dma late in an upleg, while fear peaks when the SPX is dragged back down to its 200dma in a correction or consolidation. But note that our current consolidation has yet to force the SPX back to its 200dma. This high-probability-for-success buying point is still a long way down.
So the stock-market technicals really aren’t very favorable heading into the seasonally-weak summer doldrums. While the SPX has been far less overbought in recent weeks than it was initially at its mid-February peak, it is still high relative to its 200dma. Trader psychology is unlikely to be fully rebalanced, greed and complacency totally burned away, until the SPX returns to or under its 200dma. We aren’t there yet.
Major summer rallies are pretty rare, and are only likely if the SPX is oversold and under its 200dma heading into summer. That certainly isn’t the case this year, so further rallying in the coming months is even more unlikely than usual. If the SPX continues drifting sideways in its high consolidation, it should finally get low enough relative to its 200dma to signal an oversold buying point by late summer.
But this year, I’d assign equal odds to a new correction versus a continuing consolidation for a variety of reasons. Healthy bull markets see major uplegs followed by serious corrections to rebalance sentiment. The first big upleg of this cyclical bull that climaxed in April 2010 played out this way. A sharp correction immediately after eradicated the interim high’s excessive greed and complacency, eventually spawning fear.
Our current second upleg has only seen two minor pullbacks over its entire 10-month life, one in November and one in March. So greed and complacency have reigned for far longer than usual. The longer a stock market rallies on balance without seeing any meaningful fear, the greater the odds a correction is imminent. Other indicators certainly support this thesis, as I explained in an essay in mid-April. And early summer, when many traders take vacations, is a high-probability time for sellers to gain the upper hand.
Also arguing for a selloff rather than a drift is the upcoming end of the Fed’s highly-controversial QE2 Treasury-monetization campaign. Quantitative easing, a fancy term describing creating new money out of thin air to buy bonds, is scheduled to end in late June. And all the Fed’s inflation has really correlated strongly with this stock-market cyclical bull, as I recently explained in depth in another essay. Traders are getting increasingly worried as the deadline draws nigh, and odds are many will sell in anticipation.
A weak SPX, whether it is gradually drifting lower or selling off sharply, will weigh on commodities and commodities stocks this summer through two key mechanisms. First, stock-market psychology directly drives the commodities risk trade, the desire of traders to own commodities and their producers’ stocks. Weak stock markets lead to much-less speculative demand across the entire commodities realm.
Second, SPX selloffs ignite dollar rallies or accelerate dollar bear rallies already in progress like today’s young one. And of course a stronger dollar weighs on commodities prices since all the popular ones are primarily denominated in dollars worldwide. So today’s weak SPX technicals certainly don’t bode well for commodities and commodities stocks during the upcoming summer doldrums either.
So what to do given today’s lackluster SPX technicals? Get prepared for the likely-excellent buying opportunity on the other side! Realize profits and raise cash now while stock prices are still fairly high, and start studying sectors you are interested in so you know which stocks you want to buy. It is critical to do this homework in advance before a buying opportunity arrives, as stock research takes lots of time and oversold markets never last long.
At Zeal we just finished a 2-month deep-research project looking at rare-earth stocks. We started out with the entire universe of these stocks trading in the US and Canada, over 100 of them. And then we researched each individually to gradually whittle the population down to our half-dozen favorites. These are each profiled in depth in our fascinating new 16-page fundamental report. It is now available for just $55 ($45 for subscribers), a great bargain for the fruits of hundreds of hours of expert world-class stock research. Buy yours today!
We also publish acclaimed weekly and monthly subscription newsletters. In them I discuss what is happening in the markets, why, and exactly how we can profitably trade it when the probabilities for success swing in our favor. Our trading approach has proven wildly successful over the last decade or so, as all 583 of our newsletter stock trades have averaged annualized realized gains of +52%! Subscribe today and start harnessing our hard work, knowledge, and wisdom to help you thrive in these markets!
The bottom line is these weak SPX technicals aren’t favorable heading into 2011’s summer doldrums. Though the stock markets have been drifting sideways for several months in a high consolidation, we haven’t seen any fear yet. The excessive greed and complacency ubiquitous at the recent interim highs is gradually eroding, but it has a long ways to go yet before sentiment is rebalanced. Thus selling pressure is likely.
Summer is a seasonally-weak time anyway, which will compound stock-market weakness. On top of this the upcoming end of the Fed’s QE2 is going to spawn tremendous anxiety, also exacerbating downside risks. Commodities and commodities stocks, as always, won’t weather general-stock weakness well at all. On the bright side, all of this should lead to an excellent buying opportunity later this summer. Get ready.
Adam Hamilton, CPA May 27, 2011 Subscribe at www.zealllc.com/subscribe.htm
![]()