![]()
Gold Bull Stage Two 2
Adam Hamilton November 18, 2005 2913 Words
It has been a heck of an awesome week for gold, certainly one of the most exciting in recent memory. Not only is the Ancient Metal of Kings closing in on the fabled $500 level in dollar terms, but the psychologically crucial €400 euro-gold level was finally overcome. Gold investors everywhere, including me, are rejoicing.
Contrarian investors and even some mainstreamers are discussing gold’s sizable daily gains, but I think the most intriguing aspect of gold’s action this week surrounded its relationship with the US dollar. On Wednesday gold carved a new bull-to-date high just under $478 while the US Dollar Index simultaneously hit a rally-to-date high above 92. Such an event is totally unprecedented in this gold bull, Twilight Zone stuff.
Born back in April 2001, until June 2005 this gold bull’s behavior was heavily dependent on the dollar’s fortunes. Like an inverted mirror image of the mighty US dollar, gold rose when the dollar fell and vice versa. Gold acted merely as an alternative currency to the dollar and traded as such. Global investment demand was insufficient then to drive gold high enough to decisively decouple from the dollar’s dominance.
But back in June a long-awaited event finally came to pass, euro gold broke above its long and oppressive €350 resistance. This event was so important and pivotal because it helped convince investors around the world that this gold bull was more than just a dollar bear. New euro-gold highs helped signal that gold finally had the fundamental strength to rise in all the important global currencies, not just in the rapidly devaluing US dollar.
For years I’d been waiting for the €350 breakout as it seemed like the most likely catalyst to ignite Stage Two of this gold bull. Great gold bulls have three stages. The first stage is currency-devaluation driven, gold typically only gains significantly as the world’s reserve currency loses value. The second stage is driven by global gold investment demand, forcing gold to decouple from the dominant currency and rise on its own fundamental merits.
The dawn of Stage Two has huge implications, it is when the gold bull really comes into its own and starts galloping. Stage Two is a paradise for investors since its ultimate gains ought to vastly exceed the excellent gains with which we were blessed in Stage One. Since June’s €350 breakout, it looks like this gold bull is increasingly transitioning from Stage One to Stage Two. I documented gold’s dollar decoupling a couple months ago.
This week to witness gold actually close at its highest levels in this entire bull the very same day the rallying dollar achieved its highest level this year is staggering! Gold is being driven to new highs not by flight capital fleeing a crumbling dollar, but by prudent investors around the world bidding up its price because they want to own gold. This is the clearest evidence yet of gold’s dollar decoupling, of the glorious dawn of Stage Two!
In order to better understand this phenomenally bullish event, I decided to update our Stage Two charts this week. They use euro gold as a proxy for documenting gold’s extra-dollar progress, compare rolling-month returns of gold and the dollar, and analyze both currencies’ behaviors relative to their respective 200dmas. More background information on these charts appears in my original “Gold Bull Stage Two” essay.
The fall of euro gold €400 this week is immensely bullish and very exciting! The euro has become the second-most-important currency on earth so it is a great proxy for gold’s extra-dollar progress in general. Despite the European nations’ traditional love for invading each other, the rise of the unified European Superstate and its currency appears unstoppable. Even Asian nations are now accepting payments in euros for crude oil, other raw materials, and finished manufactured goods.
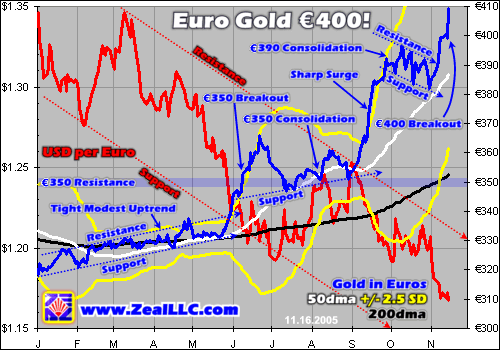
The dollar cost per euro is graphed in red on the left axis and is the best place to start digesting this chart. The currency countertrend moves that erupted in the initial days of 2005 drove the euro lower as its secular bull market entered correction mode. From January to May, the euro plunged from near $1.35 to under $1.25, a big move in the usually glacial-slow currency world. Yet euro gold barely rose during this time as it largely languished under €330.
This conundrum presented a problem for contrarian investors across the globe. The price of gold should rise when fiat currencies fall, as gold is the ultimate currency in world history. But since gold refused to rise materially in euro terms in the first five months of this year, it was obvious to foreign investors that the US dollar still dominated gold. The dollar was rising and gold was grinding lower in the States rather than responding to euro weakness.
But heading into June, gold suddenly started rising in euro terms, apparently growing more responsive to major currencies other than the dollar. Euro gold broke out of its modest early 2005 uptrend and blasted towards the €350 graveyard in the sky that had slaughtered all previous attempts to shatter it for three years running. By June gold was rising despite the dollar’s parallel strength driving euro gold well above €350.
Since these €350 levels had acted as such hardened overhead resistance for so long, a lot of investors assumed gold wouldn’t be able to hold above €350. Soon it started correcting as expected in late June. But in July euro gold bounced at €350, an encouraging action that would happen twice again in August. The old €350 resistance that had battered gold for years was increasingly becoming support for an assault on brave new highs.
As expected, this €350 breakout emboldened investors around the world. For the first time there was hard data suggesting that this gold bull was not just the puppet mirror of a dollar bear, but an independent entity that would rise globally on its own fundamental merits. Gold surged around the world in September and blasted to new bull-to-date highs in all the important currencies including the euro. And the dollar also had a strong parallel rally that same month.
Gold’s sharp surge opened investors’ eyes around the world. Instead of promptly collapsing after such a fast move, which would have been entirely justifiable technically, gold buying interest persisted. Gold spent last month consolidating near €390 rather than surrendering its gains. Investors from around the world were pouring enough capital into gold to keep it relatively high and buoyant despite the dollar’s strength.
The great thing about investments is their demand curve is inverted. The higher their prices go the more desirable they become to investors. In the past couple weeks global gold investment demand surged again driving gold above €400 for the first time in history. And all this happened, amazingly enough, not when the dollar was weak but when it was blasting up to major new rally-to-date highs. Gold is decoupling!
While extra-dollar gold charts like euro gold are certainly evidence enough that we seem to be transitioning into Stage Two, the empiricist in me always wants to precisely quantify pivotal market events. One chart I’ve been watching for a few months attempts to do this. It graphs the absolute 20-day returns of the dollar and gold. Since calendar months generally each contain about 20 trading days, in effect this is a rolling-month returns chart.
In Stage One the dollar and gold moved in nearly lockstep opposition, so if the dollar was up 3% in the last 20 days then gold would be expected to be down 3%. Indeed this is what we observe from January to May when Stage One dollar-dependent behavior governed gold. But starting in June at the €350 breakout an amazing thing happened. The strong negative correlation between the dollar and gold reversed and shot positive.
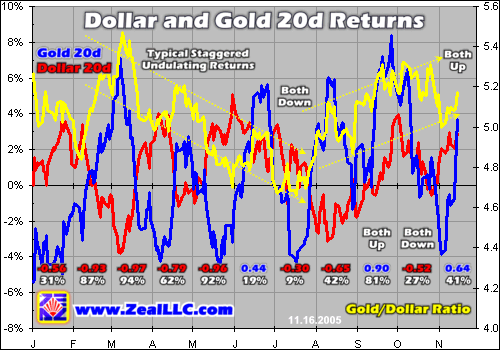
Rather than moving in opposition as expected, in June the gold 20d returns soared far faster than dollar 20d returns waned. Then in July both returns dropped, in September both rose, in October both fell, and so far this month both have risen. The actual calendar-month correlations and their r-square values are noted above. The white r-square percentages reveal how statistically likely the behavior in one currency is able to explain and predict the other’s behavior.
These correlations and r-squares are computed not on the 20d gains charted above, but on the underlying daily dollar and gold closes themselves. Check out the extremely high negative correlations above in February, March, and May. On average in these Stage One months, 91% of the behavior of gold could be attributed to the dollar. From January to May inclusive the monthly r-square average ran 73%, showing a dollar-dominated gold.
But in June this correlation actually went positive. Rather than moving in their long-established lockstep opposition, the dollar and gold suddenly tended to move in the same direction. While the 0.44 positive correlation is not large in an absolute sense, as it only represents a 19% r-square value, it is an enormous departure from what he had been seeing in gold. This is hard statistical evidence that the Stage Two developments are real.
Since this radical change of course in June, two more months have run positive correlations. In September gold and the dollar matched each other so closely that a very strong 0.90 correlation emerged. That month 81% of the behavior of gold could be statistically matched with dollar strength rather than weakness. These three positively-correlated months averaged an r-square value of 47%, very impressive early in the transition.
Meanwhile July, August, and October reverted back to the usual Stage One negative correlations. Yet these correlations were very weak compared to those witnessed in the first half of 2005. The average r-square value for these particular months was just 26%. Obviously this is a far cry from the 73% average from January to May. Statistically, verified through correlation analysis, gold is absolutely decoupling from the dollar.
With gold decoupling, an obvious question is why are we still seeing any negatively correlated months at all? Why doesn’t the metal just get on with it and leave the dollar in the dust for good? For a variety of reasons, this Stage One to Stage Two gold bull transition must be gradual, not instant.
Both gold and dollar prices are driven by investors and speculators buying and selling. For four years almost without exception gold prices were slaved to the inverse of the dollar’s fortunes. Traders are now used to naturally expecting gold to rally on dollar weakness and slide on dollar strength. In trading well-worn habits create a lot of inertia and die hard. Many traders will still be operating on a Stage One paradigm for some time to come yet until they finally realize that the gold market has fundamentally changed for the better.
Gradually investors and speculators will begin understanding the new Stage Two dynamics. Over time the number of traders with Stage One mindsets will shrink while the Stage Two crowd will grow. Stage Two will only be fully here when the vast majority of market participants accepts that gold has decoupled from the dollar to rise or fall on its own fundamental merits and they trade accordingly. No one knows how long this will take.
And measurement problems make divining the length of this transition even more challenging. For instance, gold and the dollar, even though they have tended to move in opposite ways strategically over months, can do anything they want from day to day. The shorter the period of time considered for any market analysis, the greater the obscuring influence of random noise becomes. The calendar-month correlations used above are very short and highly susceptible to being buffeted by random daily market noise.
And as this transitional decoupling into Stage Two becomes more pronounced, gold will eventually be trading totally independently of the dollar anyway. Thus the correlation analysis that was so powerful while gold moved in lockstep opposition to the dollar in Stage One will rapidly become meaningless as the respective individual fundamentals driving both currencies push them in their own independent directions. Stage Two is ultimately not a shift from negative to positive dollar and gold correlations, but from negative to no correlations.
Our final chart shows where gold and the dollar have been trading relative to their respective 200dmas. This Relativity principle is extremely useful for trading markets in secular trends and has served us well in recent years. If this Stage Two transition continues, soon the rDollar trends will probably be useless for gold trading as the dollar and gold head their separate ways. Here it really highlights the early transition though.
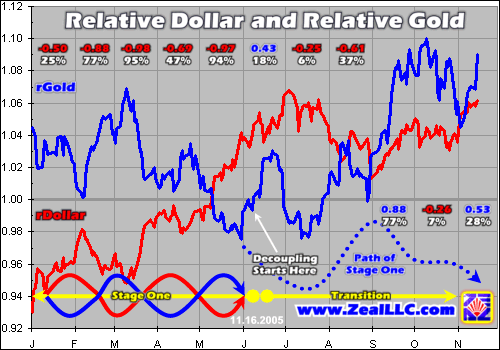
The stylized drawing on the lower left of this chart illustrates the undulating opposing patterns between gold and the dollar as multiples of their own 200dmas that characterized and defined Stage One. Once the decoupling started in June though, suddenly this mirror-image pattern vanished. The dollar climbed farther above its 200dma in a bear rally while gold simultaneously soared above its own 200dma in a new upleg.
If rGold had continued on its Stage One path since June, it would have generally followed the dotted arrow rendered above. Today gold would probably only be around 95% of its 200dma, which itself would be lower. If gold had continued Stage One behavior since June, my best guess is we would be seeing $400ish gold levels today. Instead gold decoupled and is now pushing $500 despite the dollar’s considerable strength.
In light of all this evidence, the thesis that gold is now transitioning into the second stage of its gold bull is becoming more compelling with each passing week. The behavior of gold relative to the dollar has unarguably changed since June. We can see it in the charts of gold graphed in other major currencies and we can quantify it precisely by analyzing the statistical relationship between gold and the dollar.
With Stage Two dawning, the implications for investors are profound. If you visualize a secular gold bull as a decade-plus-long parabola, the Stage One behavior we witnessed until this past summer is basically a gradually rising line. All of the greatest rallies and most exciting uplegs of the past four-and-a-half years are contained within this modest gradually rising line. The first third of a major bull market is always the least impressive.
Stage Two is when this long-term parabola starts curving up. It is when gains really start to multiply and mainstream investors around the world start lusting after gold and driving it relentlessly higher. In dollar terms the rallies and uplegs of Stage Two will tower over the Stage One events we’ve grown used to. This bull will get bigger, badder, and meaner and the opportunities to profit will grow proportionally. Fortunes will be won.
While ample opportunities to profit in this gold bull should abound in the coming years, the particular opportunity that really strikes me today is the growing anomaly between gold and gold stocks. Despite incredibly bullish technicals, gold stocks continue to lag the awesome surge in gold. Gold ultimately drives gold stocks, but at the moment gold-stock investors don’t seem to believe that Stage Two is really coming.
The HUI gold-stock index is struggling under 250 today while gold is within spitting distance of $500, a mega-psychological level that will work wonders for gold-bull awareness among mainstream investors in the States. A veritable Biblical deluge of mainstream capital could start pouring into gold stocks once gold trades decisively above $500. Yet the HUI was actually higher two years ago when gold was just first breaking $400!
This anomaly cannot be sustainable. Gold is in a powerful fundamental bull for global supply and demand reasons, investors worldwide are bidding it up forcing it to decouple from the dollar, and it’s the price of gold that drives gold-stock profits and hence ultimately gold-stock prices. The elite gold stocks have lagged so far behind this glorious early Stage Two gold surge that they ought to rocket like a bat out of hell once investors comprehend their vast potential.
At Zeal we have been layering in positions in elite unhedged gold stocks preparing for this event for many months. Our conservative HUI target for this upleg based on bull-to-date behavior, not even factoring in the Stage Two impact, is another 33% or so higher from today’s gold-stock prices. It will probably easily exceed our expectations. It is not too late to layer in great gold-stock positions for this upleg now, but it may soon be.
All of our current gold-stock and silver-stock trades, which will thrive if the HUI surges to catch up with gold, are detailed in our acclaimed monthly Zeal Intelligence newsletter. Please subscribe today before this unsustainable divergence between elite gold stocks and gold closes and ends this rare opportunity.
The bottom line is gold’s behavior is resembling early Stage Two patterns more and more with each passing week. To see this metal reach new bull-to-date highs the same day the dollar reaches yearly highs is really extraordinary and quite exciting. Gold is decoupling from the dollar with increasing zeal and one of these months it is never going to look back. It is trading on its own fundamental merits, dollar be damned.
Despite all this gold bullishness, gold-stock investors generally remain wary and worried, a perfect contrarian sign. Sooner or later gold stocks will have to acknowledge gold’s unprecedented new strength and streak higher to catch up.
Adam Hamilton, CPA November 18, 2005 Subscribe at www.zealllc.com/subscribe.htm
![]()